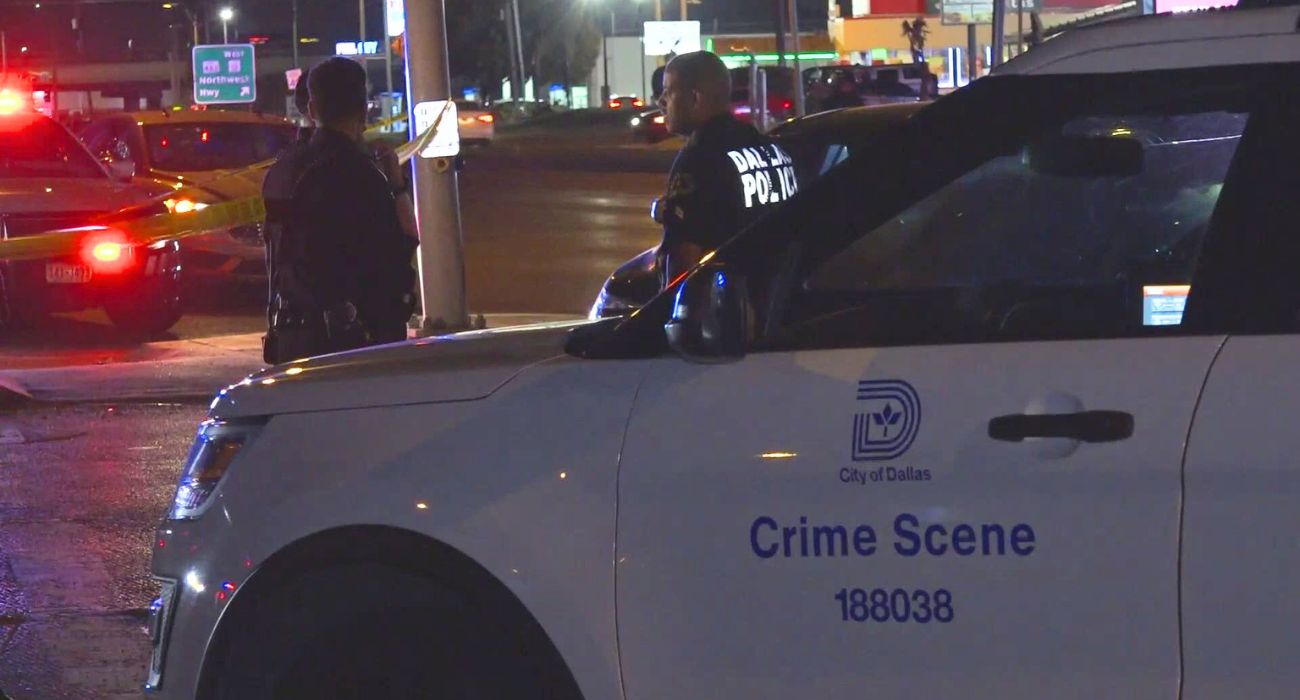
It seemed like good news when the July 2022 crime data for the City of Dallas showed resounding decreases in wrongdoing across the board for all 14 districts in the region, some plummeting by as much as 60%.
Unfortunately, the reduction was falsely inflated, as crime in the City of Dallas districts did not actually decrease at such a dramatic clip. Rather, 54% of the crimes committed and reported in July ’22 in the City of Dallas were not attributed to any district in the Dallas Open Records.
Of 11,593 crimes reported in Dallas, only 5,336 crimes were tagged with their associated district, while 6,257– 54%– were listed with no district.
Particularly concerning was the fact that the crimes whose districts went untagged are those more heavily weighted in our calculation of the crime score (i.e., “worse” crimes overall). For example, there were 8 homicides in all of Dallas, but only two of them were tagged with a district in the data that was available on Tuesday.
In the absence of actual data from the City of Dallas, The Dallas Express calculated the percentage by which crime across the city was understated and ratably adjusted each district’s Crime Score, assuming that untagged crimes occurred at the same frequency in each district as tagged crimes.
Based on this admittedly imperfect methodology, The Dallas Express estimated that District 1 and City Councilmember Chad West, Crime Boss of the Month for August, saw a 53.83% increase in Crime Score when comparing July ’22 to July ’21.
The Dallas Express, The People’s Paper, believes that important information about the city, such as crime rates and trends, should be easily accessible to you. To that end, The Dallas Express reached out to the Open Records Office in Dallas via phone and email on Tuesday. Though phone calls were not returned, the Open Records Office stated in an email that a mistake had been made and was being investigated.
“The information you requested may require additional time to retrieve,” the office wrote. “The time length will depend on the information you are requesting along with the divisions or units responsible for retrieving the responsive documents. Other factors affecting the processing of your request may include research, processing, redactions and copying. In compliance with the Government Code 552.221(d), the Open Records Unit anticipates the information may be provided within 20 business days from the date of this letter, by 10:00 am.”
In a surprising turn of events, however, the City had updated its data by Wednesday, adding the associated district to the reports for each crime. Despite this, the Open Records Office did not contact The Dallas Express to relay news of the data’s completion.
Chad West Sees a 38.35% Increase in Crime Score for July 2022
Based on the now-complete data, District 1 and Councilmember West actually saw a year-over-year increase in Crime Score of 38.35%.
Of the 31 crime categories tabulated by the City of Dallas Open Records department, 11 increased in July ’22 over July of last year based on the complete data.
Overview of Dallas District 1 Crime Score by Category
Those crime increases (highest to lowest) are:
- Motor Vehicle Theft: up 94 (from 108 in July ’21 to 202 in July ‘22)
- Assault Offenses: up 21 (from 28 to 49)
- Larceny/Theft Offenses: up 20 (from 110 to 130)
- Destruction/Damage/Vandalism of Property: up 15 (from 43 to 58)
- Trespass of Real Property: up five (from five to 10)
- Burglary/Breaking & Entering: up three (from 22 to 25)
- Public Intoxication: up three (from 12 to 15
- Hazardous Traffic Violations: up one (from 24 to 25)
- Fraud Offenses: up one (from two to three).
- Stolen Property Offenses: up one (from one to two)
Notably, the predictions made by The Dallas Express before the updated data became available actually underestimated the increase in several of the above categories, including Motor Vehicle Theft (estimated to be 178 for July ’22), Assault Offenses (estimated at 48), Burglary/Breaking & Entering (estimated at 24), Hazardous Traffic Violations (estimated to remain at 24), and Homicides (estimated to remain at zero).
Councilman West told The Dallas Express he is willing to talk about the crime increases his district has witnessed this year and the methodology for the stats used by this news outlet. An interview with West is forthcoming.
How did your area stack up on crime? Check out our interactive Crime Map to compare all Dallas City Council Districts. Curious how we got our numbers? Check out our methodology page here.


In the penultimate paragraph- mythology or methodology?
My comment exactly.